GNOME Oil Spill Modeling Lab
Goal:
After simulating an actual oil spill event, you will understand how oceanographers help to protect marine resources from pollution such as oil spills. You will use an actual modeling program, GNOME, to observe and predict oil spill trajectories. You will understand how weather and ocean conditions affect the fate of oil transport, and how modeling these conditions can help remediation efforts.
Materials:
GNOME (General NOAA Operational Modeling Environment) installed with a location file. In this case, we use the Santa Barbara location file. Also required are a pencil, lab sheet and the "GNOME manual."
Part 1:
The goal in part 1 is to test the model. Does it work? Can we actually use it? Scientists call this "hindcasting" (rather than forecasting). Hindsight is 20-20!
Procedure:
1) Set up the spill in the model using the "GNOME manual" and the details of the spill and local weather conditions provided below.
- Model Run Duration: 3 days
- Weather conditions:
Current: Davidson current ("Relaxation state")
Wind: Variable
Day 1: NNW, 10 Knots (Auto-increment by 24 hours)
Day 2: WNW, 10 Knots
Day 3: WSW, 15 Knots
- Spill location: 34 degrees 19' 54'' N and 119 degrees 36' 47'' W
- Spill amount: 100,000 barrels (non-weathering)
2) Simulate the oil spill (push "play"). Pay attention to the wind, time, and location where oil comes onshore (you can pause the simulation if you want).
Part 1 Questions:
1) Does the spill you modeled agree with the loca account of the actual Santa Barbara oil spill (below)? List some similarities and differences between the model and the observations of the actual spill.
- Yes, both were very similar and both went to the harbor
Part 2:
It is your job as a NOAA Oceanographer to do everything possible to reduce the impact of the oil spill on the coastal environment. There are 10 miles of booms available at the NOAA response station in Santa Barbara, but more booms and other coastal cleanup materials need to be loaded and drive from the Los Angeles - this will take 24 hours.
You must decide where to deploy the 10 miles of booms in Santa Barbara and what to do with the remaining resources available a day later.
- Todays Weather Conditions:
Current: Winter (Sep-Feb) choose "Relaxation"
Spring (Feb-May) choose "Upwelling"
Summer (June-Aug) choose "Convergent"
Wind: 10 Knots, ESE (all three days) or consult the local forecast.
- Spill location: 34 degrees 19' 54'' N and 119 degrees 36' 47'' W
- Spill Amount: 100,000 barrels (non-weathering)
Part 2 Questions:
1) Describe some of the differences between the 1969 Santa Barbara oil spill and this hypothetical spill.
- The hypothetical spill spreads more along the left side of the shore. The 1969 Santa Barbara oil only went onto the shore in one spot.
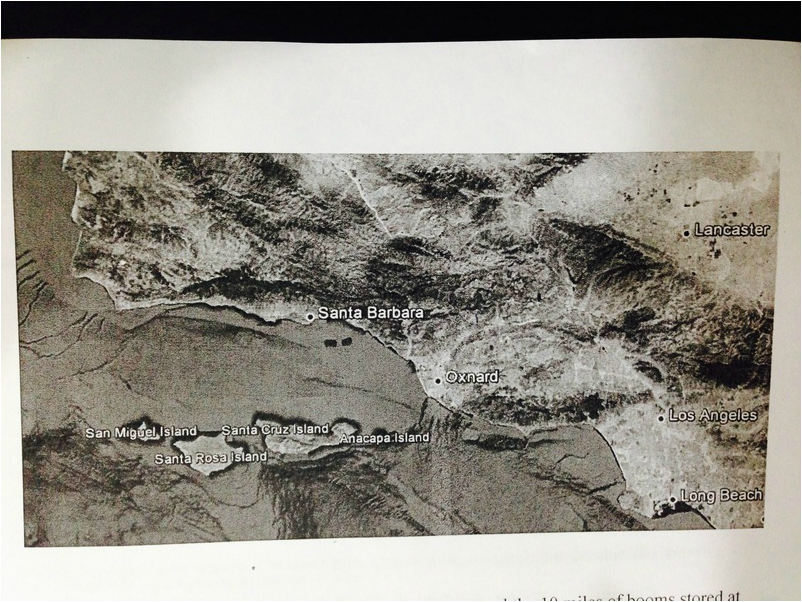
2) Where did the oil make landfall after the first day? How about the second and third days? You can indicate on the map on the next page:
- The oil made landfall on the left side of Santa Barbara harbor.
After simulating an actual oil spill event, you will understand how oceanographers help to protect marine resources from pollution such as oil spills. You will use an actual modeling program, GNOME, to observe and predict oil spill trajectories. You will understand how weather and ocean conditions affect the fate of oil transport, and how modeling these conditions can help remediation efforts.
Materials:
GNOME (General NOAA Operational Modeling Environment) installed with a location file. In this case, we use the Santa Barbara location file. Also required are a pencil, lab sheet and the "GNOME manual."
Part 1:
The goal in part 1 is to test the model. Does it work? Can we actually use it? Scientists call this "hindcasting" (rather than forecasting). Hindsight is 20-20!
Procedure:
1) Set up the spill in the model using the "GNOME manual" and the details of the spill and local weather conditions provided below.
- Model Run Duration: 3 days
- Weather conditions:
Current: Davidson current ("Relaxation state")
Wind: Variable
Day 1: NNW, 10 Knots (Auto-increment by 24 hours)
Day 2: WNW, 10 Knots
Day 3: WSW, 15 Knots
- Spill location: 34 degrees 19' 54'' N and 119 degrees 36' 47'' W
- Spill amount: 100,000 barrels (non-weathering)
2) Simulate the oil spill (push "play"). Pay attention to the wind, time, and location where oil comes onshore (you can pause the simulation if you want).
Part 1 Questions:
1) Does the spill you modeled agree with the loca account of the actual Santa Barbara oil spill (below)? List some similarities and differences between the model and the observations of the actual spill.
- Yes, both were very similar and both went to the harbor
Part 2:
It is your job as a NOAA Oceanographer to do everything possible to reduce the impact of the oil spill on the coastal environment. There are 10 miles of booms available at the NOAA response station in Santa Barbara, but more booms and other coastal cleanup materials need to be loaded and drive from the Los Angeles - this will take 24 hours.
You must decide where to deploy the 10 miles of booms in Santa Barbara and what to do with the remaining resources available a day later.
- Todays Weather Conditions:
Current: Winter (Sep-Feb) choose "Relaxation"
Spring (Feb-May) choose "Upwelling"
Summer (June-Aug) choose "Convergent"
Wind: 10 Knots, ESE (all three days) or consult the local forecast.
- Spill location: 34 degrees 19' 54'' N and 119 degrees 36' 47'' W
- Spill Amount: 100,000 barrels (non-weathering)
Part 2 Questions:
1) Describe some of the differences between the 1969 Santa Barbara oil spill and this hypothetical spill.
- The hypothetical spill spreads more along the left side of the shore. The 1969 Santa Barbara oil only went onto the shore in one spot.
2) Where did the oil make landfall after the first day? How about the second and third days? You can indicate on the map on the next page:
- The oil made landfall on the left side of Santa Barbara harbor.
3) As a NOAA Oceanographer, where would you recommend the 10 miles of booms stored at Santa Barbara be deployed? Where would you send the extra resources from LA; a days drive away?
- The booms should be deployed near Santa Barbara on the first and second day. On the third day the extra resources should be sent west of Santa Barbara.
- The booms should be deployed near Santa Barbara on the first and second day. On the third day the extra resources should be sent west of Santa Barbara.
Part 3:
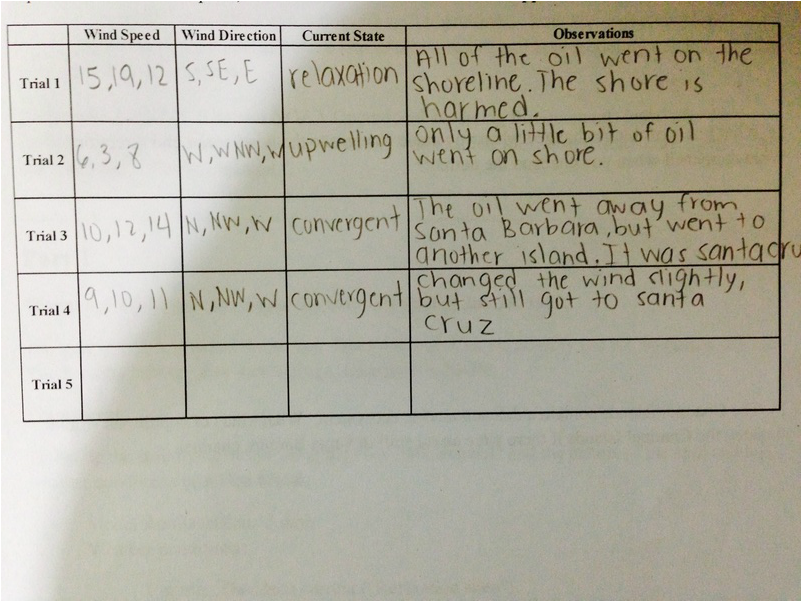
Experiment with wind speed, direction and current. See what happens!
Experiment with wind speed, direction and current. See what happens!
Lab Questions:
1) What are some important variables in the model? Why are they important? Which do you think are the most important variables that determine where the oil will end up?
- Some of the most important variables were wind speed, wind direction, and current direction. These are important because these determine where the oil will end up. I think current direction is the most important variable that determines where the oil will end up because the oil will spill into the ocean, and the currents will take it wherever.
2) What kinds of things changed when you made changes to the wind speed and direction? What happened when you changed the current?
- The oil was pushed in different directions and ended up near a shore or an island.
3) The Channel Islands contain a delicate marine ecosystem. What kinds of conditions would threaten the Channel Islands if there were an oil spill in Santa Barbara channel.
- If there was an oil spill, the conditions that would threaten the Channel Islands are unclean water and how the oil will stick to animals. For the unclean water, the oil will block the surface of the ocean, making it harder, not impossible, for plants to photosynthesis. When this happens, the amount of oxygen in that area slowly decreases, and ends up killing the plant due to no photosynthesis. For oil sticking, sea birds need their wings to fly. So, to get it off, the birds eat it. Since oil is poisonous, the bird end up dying.
4) Although this model was actually used by NOAA, it is several years old. Newer versions take several other factors into account. Can you think about other things that may affect how oil moves around that arent modeled in this simulation and would improve the accuracy of the model?
- Oil may move around by being pushed by ships that come into a harbor/port of some sort. If an oil barrel spills, there might be some oil left over in the barrel, and the barrel may be pushed by the waves.
